Most of the theory, concepts, and background information about the detectors used in this simulation were given in "The Simulation" section previously. In this section, examples of the five detector screens will be given along with a description of the buttons, switches, and other features associated with each detector screen. All of the detectors are turned on by clicking the red and green buttons on the detector on the optics table. The detectors are turned off by clicking the red and green buttons again or by clicking the on/off button on the detector screen. The detectors are passive in that they do not affect the outcome of an experiment but instead only detect or measure certain physical phenomena. The interpretation of this output from each detector forms the fundamental learning objective of these simulations.
 Phosphor Screen. A phosphor screen is used to detect high-energy particles such as electrons or alpha particles. When a high-energy particle impacts the phosphor screen, the phosphor momentarily glows as a small spot at the position of impact. The brightness of a spot or area on the phosphor screen is a qualitative measure of the number of particles or intensity of the beam at that location. An actual phosphor screen is not an electronic device, but in the simulation it is treated as such in order to be consistent with the other detectors.
The four buttons on the phosphor screen include (1) Save Screen, which saves the current detector output to the lab book; (2) Clear, which clears or cleans the phosphor screen; (3) Persist, which puts the phosphor screen into a mode where the individual impacts of particles are saved and do not disappear; and (4) Grid, which overlays a grid on the phosphor screen in order to measure the positions of spots on the screen.
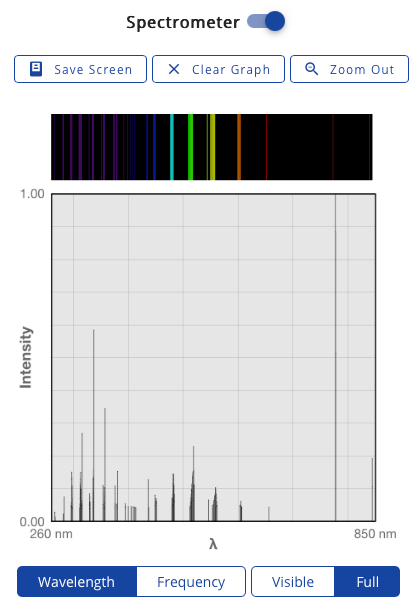
Spectrometer. A spectrometer is used to measure the intensity of light over a wide range of wavelengths. The spectrometer used here can operate at any necessary wavelength and plots the intensity of the detected light as a function of wavelength. The plotted intensity is expressed as a relative intensity from 0 to 1. The "relative" nature of the intensity changes depending on the experiment being performed. The intensity display can be toggled to Absorbance when Liquids are the samples chosen. The spectrometer cannot measure single photon events.
An important feature of the spectrometer is the ability to zoom in on selected portions of the spectrum. This is done by clicking and then dragging the cursor over a selected region of the spectrum causing a blue box to outline the selected region. Releasing the mouse will enlarge the selected region in the viewing window. This process can be repeated in order to achieve the necessary resolution.
The buttons and switches on the spectrometer include (1) the Wavelength/Frequency switch, which allows the spectra to be plotted as a function of wavelength or frequency; (2) the Full/Visible switch, which plots either the full spectrum or just the portion in the visible region; (3) the Save Screen button, which saves the current detector output to the lab book; (4) the Zoom Out button, which zooms out to the previous level of detail; (5) Clear Graph, which clears or cleans the graph display, if applicable; (6) the Intensity/Absorbance switch, which plots either the intensity or the absorbance spectra for liquids; (7) the Save Time Data button, which appears when using Kinetics liquids, which allows the user to select a specific wavelength and then click Save Data to save the absorbance data over time to the Lab Book.
Other important elements of the spectrometer window are the x, y coordinate boxes, which show the current x, y coordinates of the cursor in the units specified on the graph, and the processing meter, which indicates when the spectrometer is processing data.
 Video Camera. An "everyday" video camera detects the wavelength and spatial location of photons as they strike the detector. In the simulation, of course, the video camera has been idealized to be able to detect photons of all wavelengths inside or outside the visible region. Essentially, the video camera and phosphor screen are similar in that they both detect the spatial locations of particles as they strike the detector except a phosphor screen detects electrons and alpha particles and a video camera detects photons. Both detectors indicate the intensity using brightness. The video camera can also measure the energy of photons in the visible region (the frequency) using color.
The video camera is essentially the "eyes" of the laboratory. When the video camera is placed on the optics table it will "take a picture" of what it sees at the sample position. In certain experiments, such as the Millikan oil drop experiment and two-slit diffraction with photons, the video camera view will be magnified or changed as appropriate for the experiment, but in most cases the video camera will show an image of what is happening at the sample position even if that involves explosions, metals melting, or smoke.
The buttons on the video camera include (1) Save Screen, which saves the current detector output to the lab book; (2) Persist, which puts the video camera into a mode where the individual impacts of photons are saved and do not disappear (this is not a freeze frame mode); and (3) Slow Motion, which puts the video camera into slow-motion mode. (This is only available during the Millikan oil drop experiment.) During the Millikan oil drop experiment, there is also a Timer available, which allows the velocity of the oil drops to be measured even in slow motion. The Arrow button is used to start the timer, pressing the button again pauses the timer, and the  button resets the timer.

Photodiode. A photodiode detects the integrated intensity of light over all wavelengths. That is, a photodiode is not wavelength specific but integrates the intensity of light over all wavelengths it can detect. In the simulation, the photodiode measures this intensity as a function of time. As with the spectrometer, the intensity is displayed as a relative intensity from 0 to 1.
The buttons on the photodiode include (1) Save Screen, which saves the current detector output to the lab book, and (2) Clear Graph, which resets the time trace back to zero.
Bolometer. A bolometer is used to measure the energy and intensity of particles over a wide range of energies. The energies of these particles are measured in eV or in joules. The bolometer used here can detect electrons or alpha particles and plots the intensity of these particles as a function of energy or plots the integrated intensity as a function of time. The plotted intensity is expressed as a relative intensity from 0 to 1. The "relative" nature of the intensity changes depending on the experiment being performed. The bolometer cannot measure single particle events. In most ways, the bolometer is equivalent to the spectrometer and photodiode except it detects particles instead of photons.
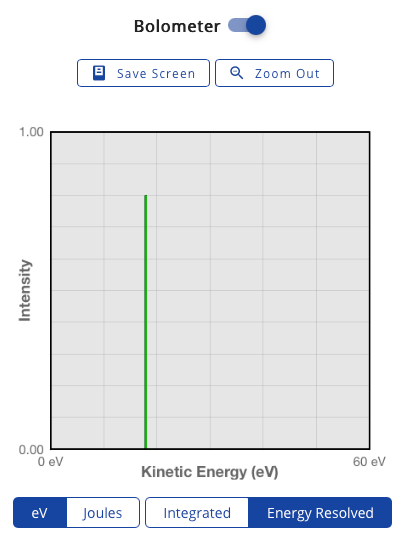
An important feature of the bolometer is the ability to zoom in on selected portions of the energy spectrum. This is done by clicking and then dragging the cursor over a selected region of the spectrum causing an orange box to outline the selected region. Releasing the mouse will enlarge the selected region in the viewing window. This process can be repeated in order to achieve the necessary resolution.
The buttons and switches on the bolometer include (1) the Energy Units switch, which allows the energy to be plotted in eV or joules; (2) the Mode switch, which sets the detector in either the Energy Resolved mode or Integrated mode; (3) the Save Screen button, which saves the current detector output to the lab book; and (4) the Zoom Out button, which zooms out to the previous level of detail.
Other important elements of the bolometer window are the x, y coordinate boxes, which show the current x, y coordinates of the cursor in the units specified on the graph, and the processing meter which indicates when the bolometer is processing data.